Marketing Insight Report
INTRODUCTION
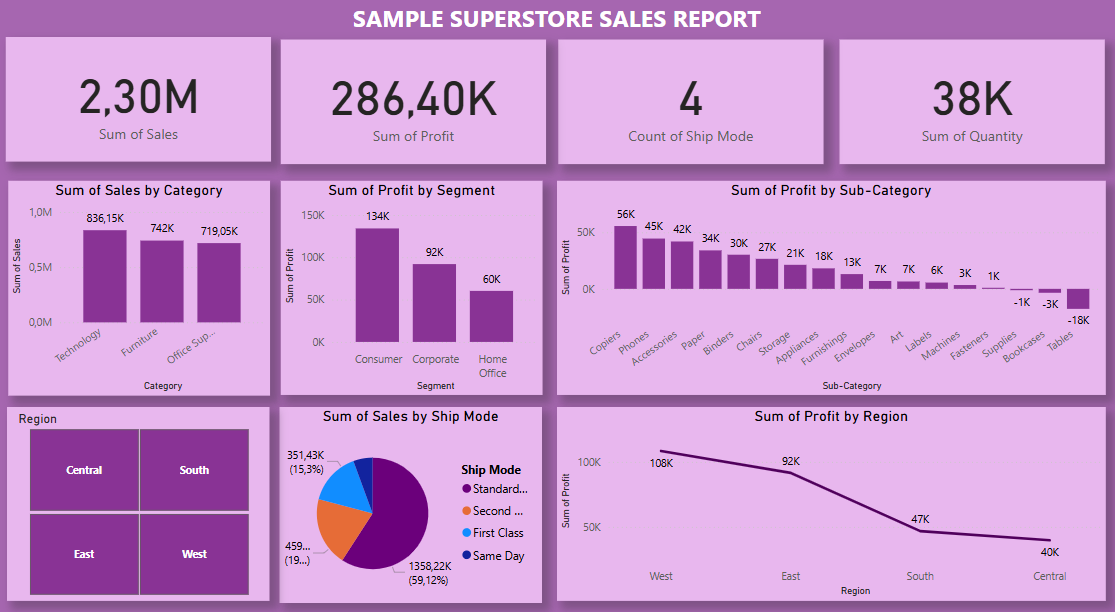
This report analyzes a dataset from Kaggle, containing 9,994 rows and 13 columns of Superstore sales data. It provides insights into various sales attributes, with the goal of identifying trends and offering recommendations to enhance sales performance and profitability.
The key attributes of this analysis include:
- Country, State, City, Region (Geographical Data);
- Category and Sub-Category;
- Sales,Discount, Quantity and Profit (Financial indicators);
- Ship Mode & Segment.
OBSERVATIONS
* Sales & Profit Analysis
- Technology leads in performance, achieving $836K in sales and $145K in profit.
- Furniture records $742K in sales but struggles with low profitability ($18K) due to significant discounts.
- Office Supplies maintain consistent sales ($719K) with a moderate profit of $122K.
Key Takeaway: Strengthen investments in Technology while optimizing Furniture’s pricing strategy to boost profit margins.
* Regional Insights
- The West region generates the highest profit ($108K), followed by the East ($91K).
- South ($46K) and Central ($39K) show lower profitability, which is primarily due to higher discount rates.
Key Takeaway: Enhance marketing efforts in West and East, while refining pricing strategies in South to improve margins.
* Shipping Mode Efficiency
- There are four types of shipping modes. The Standard Class is the most commonly used shipping method, followed by Second Class.
Key Takeaway: Increasing the use of First-Class and Same-Day shipping could enhance profitability and customer satisfaction.
CONCLUSION
This analysis reveals essential business opportunities:
- Technology remains the most profitable category, while Furniture requires cost optimization.
- The West region presents the greatest growth potential, whereas the South demands a revised pricing strategy.
- Businesses should re-evaluate their shipping strategies to ensure a balance between cost efficiency and profitability.
Comments
Post a Comment